Where the Grid Meets the High Plains
The Ogallala Aquifer is depleting. That statement carries more weight in Ford County, Kansas than in many other areas of the High Plains.[1]
The aquifer underlies approximately 174,000 square miles across eight states and supports the irrigated agricultural production that defines southwest Kansas. Ford County sits directly inside Groundwater Management District 3, where declining groundwater levels are no longer a projected future event — they are an ongoing problem.[2] Municipal supply, feedlots, and the transition away from dryland farming all depend on decisions being made right now about how land and energy are managed.
This project applies multi-criteria decision analysis (MCDA) using weighted overlay in a GIS framework to produce a county-scale solar siting suitability surface for Ford County. Four factors drive the analysis: proximity to existing transmission infrastructure, land cover class, terrain slope, and proximity to primary road access. The output is a continuous suitability surface reclassified into four interpretable classes, paired with a sensitivity analysis testing five alternative weighting scenarios.
The goal is not to identify specific parcels for development. It is to demonstrate how spatial analysis can inform land use planning at the county scale in a region where water, energy, and agriculture are deeply connected.
| Factor | Weight | Baseline |
|---|---|---|
| Transmission Proximity | 40% | |
| Land Cover (NLCD) | 25% | |
| Terrain Slope | 20% | |
| Road Proximity | 15% |
Data & Software
All analyses were completed in QGIS 3.44 (Solothurn). Four factor rasters were produced based upon source data obtained entirely from public databases. These included the USDA National Land Cover Database 2024 (mrlc.gov), which provided land cover information. Elevation data was obtained from the Kansas Data Access and Support Center's (DASC) 1-meter bare earth LiDAR Digital Elevation Model — the highest resolution publicly accessible DEM available for Ford County. Primary (S1100) and secondary (S1200) highways were identified from U.S. Census Bureau TIGER/Line 2024. Transmission infrastructure was obtained from the Homeland Infrastructure Foundation-Level Data (HIFLD) database. County boundary source data was also acquired from Census TIGER/Line 2024.
NLCD 2024 Land Cover
Reprojected from WGS84 Albers to EPSG:3420 using nearest neighbor resampling, preserving discrete integer class values. Reclassified to 1–5 suitability using 0.5-unit buffer ranges around each class code. Developed, Water, and Wetland classes excluded as NoData.
USGS 3DEP 1m LiDAR DEM (DASC)
Reprojected to EPSG:3420 prior to slope calculation. GDAL slope tool: SCALE=1.0, AS_PERCENT=True. Both horizontal and vertical units in US survey feet in EPSG:3420 — no z-factor correction required. Maximum slope values exceeded 400% at Arkansas River cut banks — physically realistic at 1m resolution. Resampled to 30m for overlay.
Transmission Lines (HIFLD)
Rasterized with burn value=1, background=0. GDAL proximity analysis from all cells with value=1. Distance breaks in US survey feet: 0–1,320=5; 1,320–2,640=4; 2,640–5,280=3; 5,280–15,840=2; >15,840=1.
Roads — TIGER/Line 2024
Filtered to MTFCC codes S1100 (primary) and S1200 (secondary). Same proximity analysis and break structure as transmission. All four input rasters aligned to NLCD raster extent and origin at 30m resolution prior to weighted overlay.
NLCD Reclassification Scheme
| NLCD Class | Code(s) | Score | Rationale |
|---|---|---|---|
| Hay / Pasture | 81 | 5 | Highest utility for solar — minimal habitat disruption |
| Grassland / Herbaceous | 71 | 5 | Low productivity, high solar potential |
| Barren Land | 31 | 5 | No competing land use |
| Cultivated Crops | 82 | 4 | Productive ag land — suitable but competing use |
| Shrub / Scrub | 52 | 4 | Generally suitable with minor clearing |
| Forest (all) | 41, 42, 43 | 2 | Significant clearing required |
| Developed (all) | 21–24 | Excluded | Urban/suburban — not available for utility solar |
| Open Water | 11 | Excluded | Not suitable |
| Wetlands | 90, 95 | Excluded | Regulatory constraint |
Weighted Overlay & Classification
The weighted overlay was performed in the QGIS Raster Calculator using the following baseline weights: transmission proximity=0.40, land cover=0.25, slope=0.20, road proximity=0.15. These weights reflect a basic economic fact: interconnection cost represents the greatest barrier to financial feasibility for utility-scale solar projects located distant from established transmission infrastructure.[5][6] Projects located far from established transmission may face interconnection queue wait times of five or more years[5] and significant infrastructure build-out costs regardless of how flat and open the land is.[6]
The continuous weighted overlay output ranged from approximately 1.25 to 5.00, with a mean of approximately 3.15. Classification breaks were developed based on the actual output distribution rather than theoretical equal-interval breaks across the full 1–5 range:
| Class | Score Range | Label |
|---|---|---|
| ● | 1.25 – 2.50 | Low Suitability |
| ● | 2.50 – 3.25 | Low-Moderate Suitability |
| ● | 3.25 – 4.00 | Moderate-High Suitability |
| ● | 4.00 – 5.01 | High Suitability |
A sensitivity analysis was performed using four additional weighting scenarios: Grid Priority (TX=0.55), Land Priority (NLCD=0.45), Terrain Priority (Slope=0.35), and Equal Weights (each factor=0.25). This approach follows established practice in GIS-based solar siting MCDA literature.[3][4]
Section line artifacts visible in the suitability surface reflect retention of county road network geometry during rasterization. The result preserved the Public Land Survey System grid as a contextual reference texture — not a problem to correct, but a byproduct worth documenting.
S1 — Baseline
Transmission-Weighted
Scenario Analysis
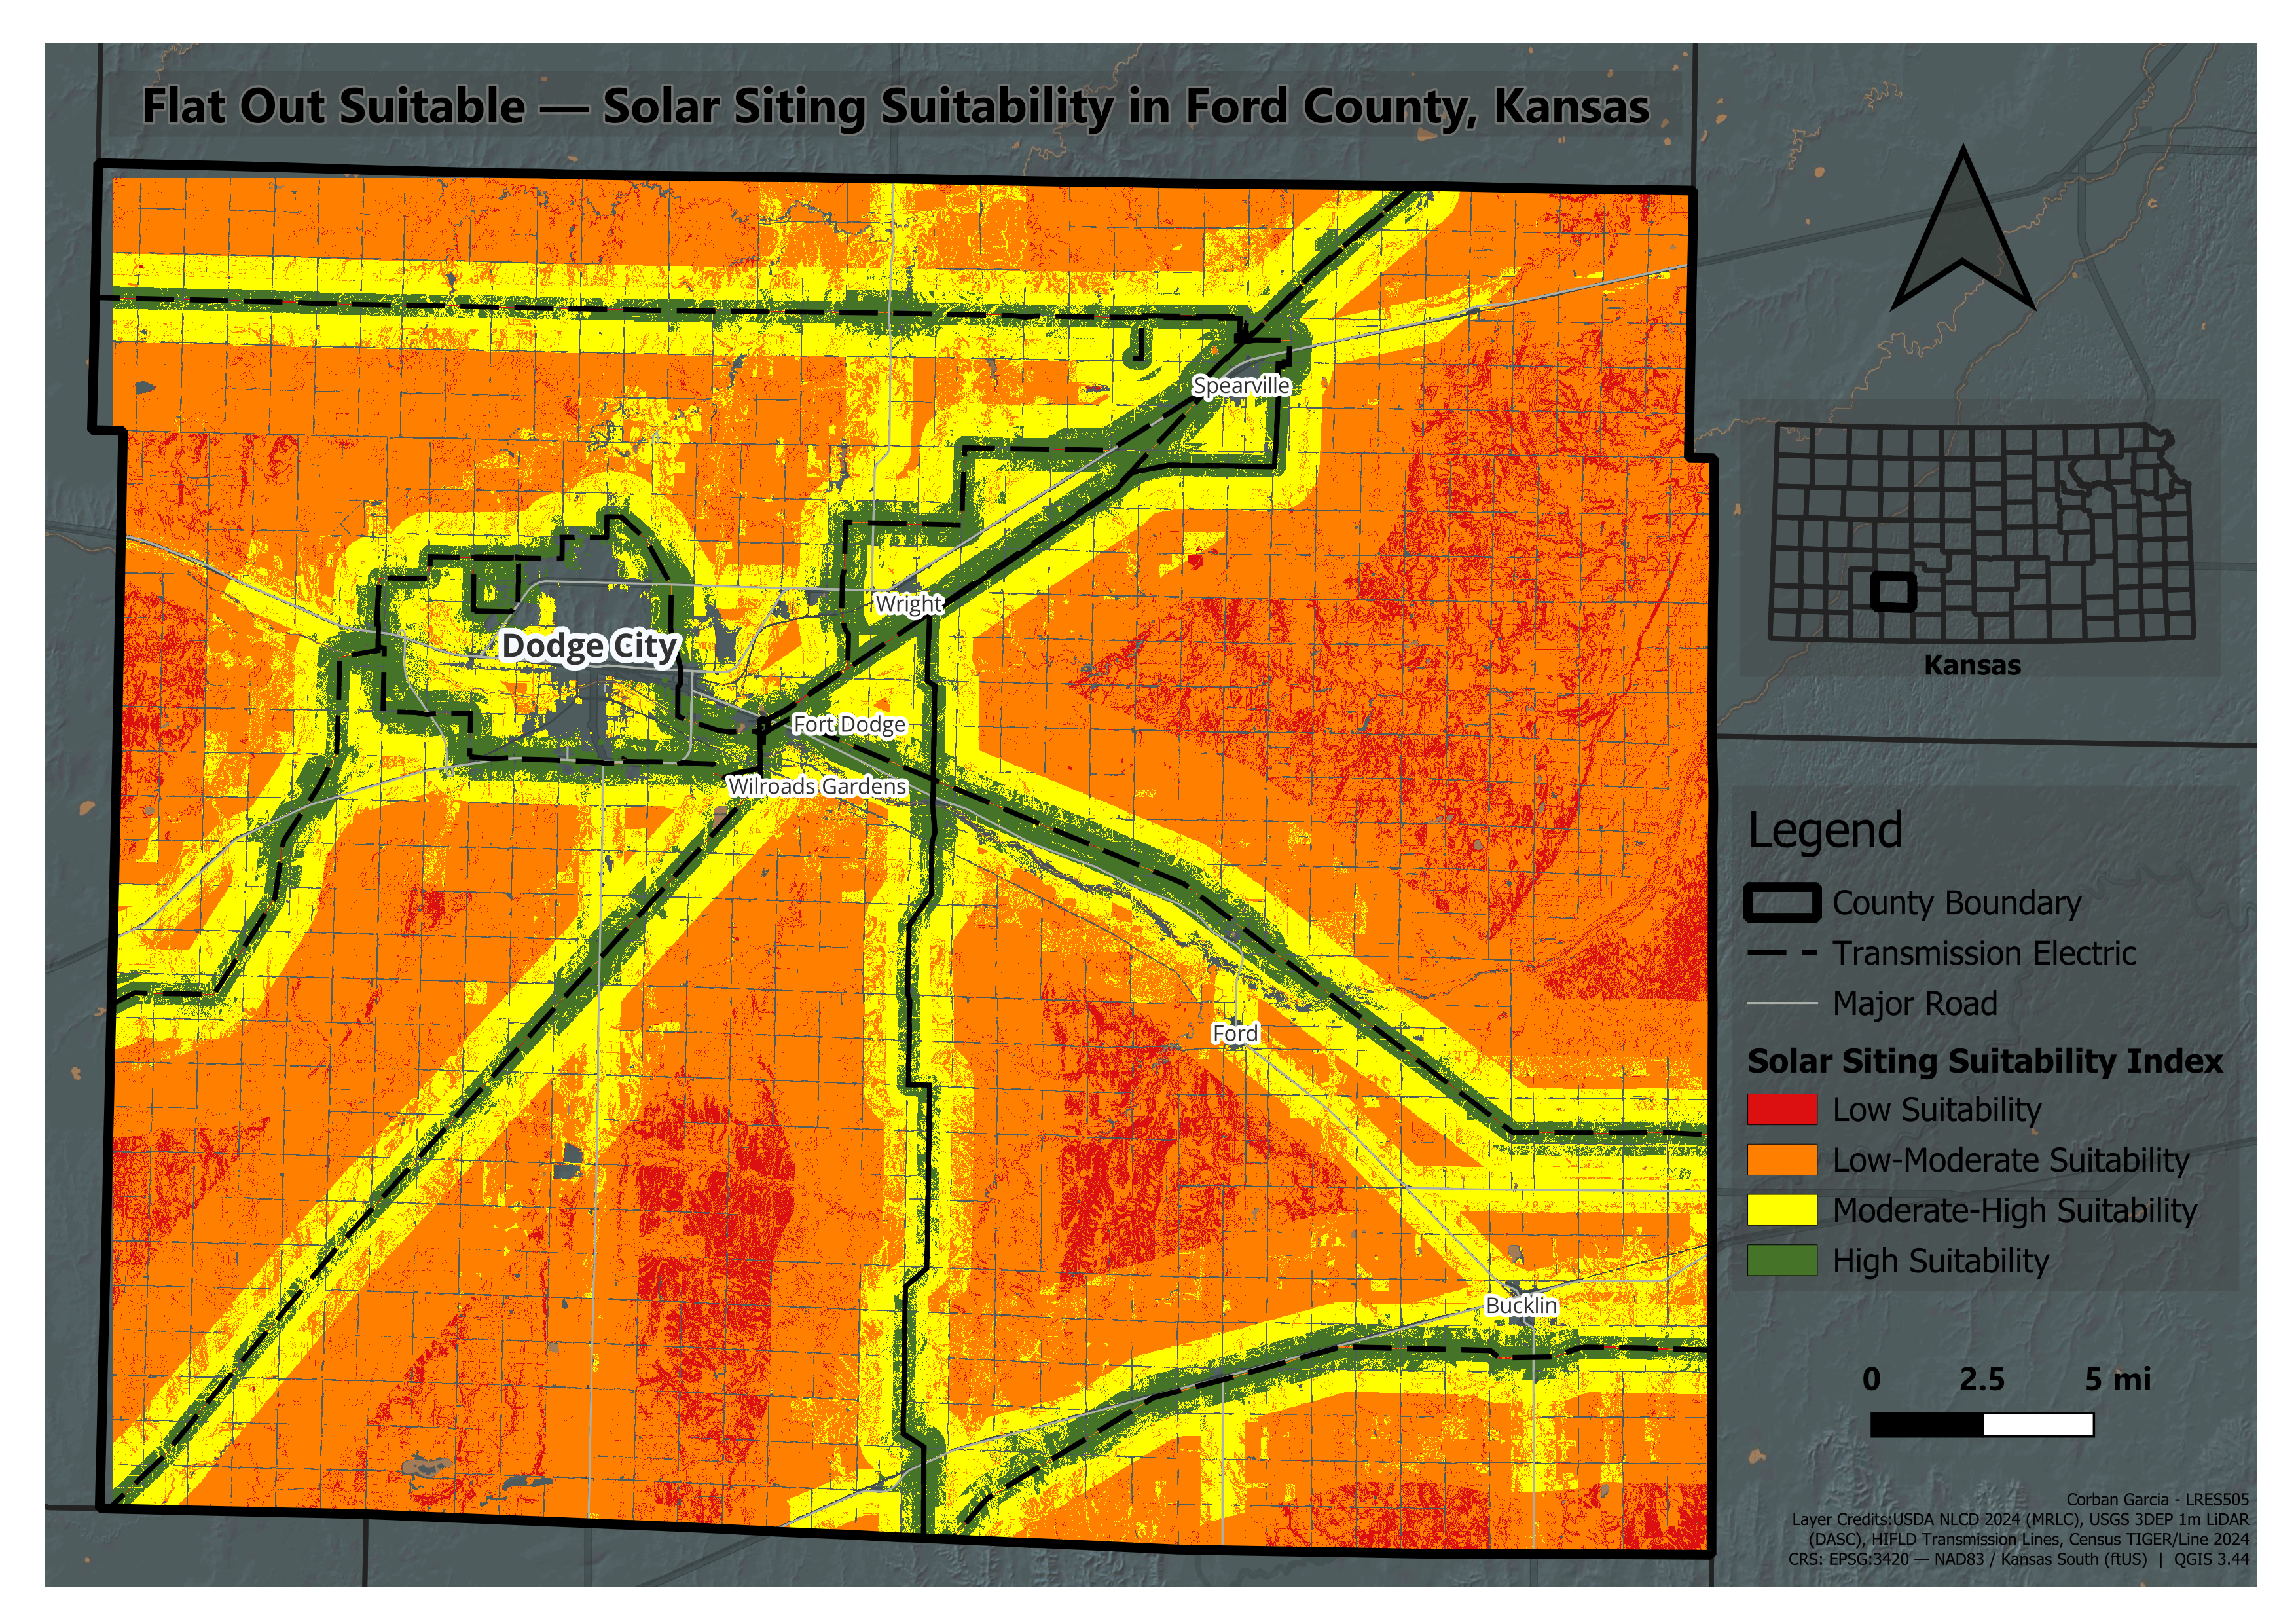
The baseline result shows High Suitability concentrated along existing transmission corridors, reflecting the 40% weight assigned to interconnection access. The mean composite score of 3.15 indicates Ford County is broadly suitable at the county-aggregate level — consistent with its character as flat, open, agricultural land with a pre-existing electrical grid. Low Suitability areas appear primarily in the southwestern portion and along steeper terrain associated with the Arkansas River drainage.
Overall Suitability Surface
Ford County is generally suitable for utility-scale solar development. That is the headline conclusion.
The baseline weighted overlay covered approximately 89.3 percent of Ford County; the remainder (approximately 10.7 percent) was designated as NoData, primarily due to the Dodge City urban core and water and wetland features along the Arkansas River corridor. The mean composite suitability score of 3.15 reflects what anyone familiar with traveling through southwest Kansas already recognizes: Ford County consists largely of flat, accessible agricultural land with a pre-existing electrical grid capable of moving power.
High Suitability areas are largely concentrated along existing transmission corridors. This is no coincidence — it is a direct consequence of assigning 40% weight to transmission proximity, and it accurately reflects what developers focus on when selecting sites for solar development. High-suitability bands extend outward from major lines and gradually decrease in suitability class with increasing distance (Moderate-High to Low-Moderate). Low Suitability areas are evident primarily in the southwestern portion of Ford County and in areas of steeper topography associated with the Arkansas River drainage system.
Sensitivity Analysis
The sensitivity analysis demonstrated an important nuance: the presence of the transmission corridor pattern is real, but it does not tell the complete story.
The Grid Priority scenario (TX=0.55) caused high-suitability areas to become more densely aggregated around existing transmission corridors, and much of the county interior shifted toward Low Suitability. This illustrates what occurs when interconnection cost is considered the dominant criterion — consistent with documented market conditions where queue wait times average five or more years and network upgrade costs can exceed $500/kW for projects in constrained areas.[5][6]
The Land Priority scenario (NLCD=0.45) produced the most dramatic departure from the baseline. Ford County's agricultural interior — dominated by Hay and Pasture — opened up substantially, with the county shifting predominantly toward Moderate-High Suitability. This reveals a large pool of potentially developable land when transmission distance is de-emphasized. The Terrain Priority scenario (Slope=0.35) produced minimal change, as expected. Ford County is essentially flat. The Equal Weights scenario produced the most diffuse suitability surface, smoothing the corridor effect without eliminating it.
Discussion
The dominance of transmission proximity in the baseline scenario is not an analytical artifact. It reflects a key aspect of commercial realities faced by all participants in renewable energy markets — namely the length (typically multiple years) of interconnection queues in almost every ISO/RTO region, and the tendency of network upgrade costs to be the marginal decision variable for smaller-scale projects.[5] As of 2023, the typical project spent approximately five years from interconnection request to commercial operation, with solar projects achieving only a 14% completion rate among those requesting interconnection between 2000 and 2018.[5] Weighting transmission at 40% is arguably conservative — the actual weight applied in real-world site selection scenarios is likely greater.
That said, the Land Priority scenario is worth sitting with. Under the NLCD-based methodology, Ford County's agricultural nature is an asset — not neutral backdrop. Hay and Pasture land scores 5. Most of the county comprises Hay and Pasture or Cultivated Crops. Reducing the transmission weight further supports the notion that while much of the county is well-suited for large-scale solar deployment, it is primarily constrained by infrastructure access, not geographic constraints per se.
Several limitations constrain this analysis. Protected areas and municipal boundaries were not implemented as formal hard exclusions. Active oil and gas leases, conservation easements, and existing solar installations were not accounted for. Parcel-level ownership patterns and the practical challenge of negotiating lease agreements with individual landowners are absent from the modeling framework. Any subsequent effort to bridge the gap between county-wide suitability assessment and project-specific site evaluation would require addressing these omissions. The slope reclassification breaks used in this analysis reflect the industry-recognized threshold of roughly five degrees (approximately 8.75% grade) as the practical upper limit for utility-scale solar development.[8]
The Ogallala context matters in a way that goes beyond background. Utility-scale solar on agricultural land reduces irrigation demand. Lease revenues can sustain farm operations during the transition away from irrigated production. Agrivoltaic configurations — the simultaneous use of the same land for solar PV and agricultural activities[7] — represent an emerging approach that a spatial framework like this one could help evaluate at scale. Global agrivoltaic deployment grew from 5 MWp in 2012 to 14 GWp by 2021,[7] and the agricultural interior of Ford County represents exactly the kind of landscape where these configurations merit serious evaluation.
Conclusion
Ford County, Kansas possesses sufficient quantities of land, sunlight, and increasingly grid infrastructure to accommodate substantial utility-scale solar generation. This analysis has demonstrated that clearly.
The weighted overlay approach successfully differentiates suitability across the county landscape and holds up across alternative weighting assumptions. The primary finding — that suitability is highly correlated with proximity to transmission infrastructure — is robust across the sensitivity analysis scenarios. Stepping back from transmission as the dominant factor reveals a larger body of land with potential for solar deployment at the agricultural scale.
Spatializing this analysis provided insight that tabular approaches cannot: solar development opportunity in Ford County is not uniformly distributed. It is structured around infrastructure. Where the grid goes, opportunity follows. That finding carries direct implications for cooperative and utility planners — and for the communities between Dodge City and Bucklin that will live with those decisions for decades.
Future work should incorporate parcel-level property rights data, formal protected area exclusions, and updated interconnection queue information. This analysis provides the spatial foundation upon which those more refined investigations can build.
Literature Cited
-
2025. Groundwater levels fall across western, south-central Kansas. Kansas Geological Survey News Release, February 14, 2025.
kgs.ku.edu/news/article/groundwater-levels-fall-across-western-south-central-kansas -
2024. Impacts to the Ogallala Aquifer: How Changes in Long-term Weather Patterns May Affect Groundwater Resources. United States Department of Agriculture.
climatehubs.usda.gov — Ogallala Overview -
2023. Site suitability analysis for implementing solar PV power plants using GIS and fuzzy MCDM based approach. Solar Energy 249:642–650.
doi.org/10.1016/j.solener.2022.11.046 -
2024. Site suitability assessment for solar power plants in Bangladesh: a GIS-based analytical hierarchy process (AHP) and multi-criteria decision analysis (MCDA) approach. Renewable Energy 220:119595.
doi.org/10.1016/j.renene.2023.119595 -
2024. Queued Up: 2024 Edition. Characteristics of Power Plants Seeking Transmission Interconnection As of the End of 2023. Lawrence Berkeley National Laboratory.
emp.lbl.gov/queues -
2023. Tackling High Costs and Long Delays for Clean Energy Interconnection. Office of Energy Efficiency & Renewable Energy, Interconnection Innovation e-Xchange (i2X).
energy.gov/eere/i2x — Interconnection Costs and Delays -
2024. Dual Land Use for Agriculture and Solar Power Production: Overview and Performance of Agrivoltaic Systems. IEA Photovoltaic Power Systems Programme Task 13.
iea-pvps.org — Dual Land Use for Agriculture and Solar -
2020. Considerations for Future Utility Scale Solar Farm Developments. University of Kentucky Agricultural Economics Staff Paper 498.
agecon.ca.uky.edu — AEC Staff Paper 498